Decomposing Personal Income Tax Redistribution with Application to Italy
Di Caro P., 2020 – Journal of Economic Inequality
What are the effects of the main tax expenditures of the Italian Personal Income Tax (IRPEF) on vertical and horizontal equity?
Personal income taxation is one of the most important pillars of the tax-benefit system in different countries; it is used for redistributive purposes and represents one of the main sources of public revenues. In Italy, in 2020 (last available data from the Italian Ministry of Economy and Finance – Department of Finance), the net IRPEF was equal to about 160 billion euro, around 10% of the national gross domestic product-GDP. International organizations, such as the IMF and the OECD, suggest reducing the number of tax expenditures, which count for about 2% of the Italian GDP – according to recent estimates of the IMF – in order to reduce the distortions of the tax system and promote efficiency. However, the recalibration of tax expenditures can be motivated also on distributive grounds.
In a research paper published in The Journal of Economic Inequality, Decomposing Personal Income Tax Redistribution with Application to Italy, Paolo Di Caro studies the effects of IRPEF tax expenditures on both vertical and horizontal equity, by applying a new methodology and providing evidence for the Italian case.
The analysis is based on a new sample of tax microdata for the fiscal year 2014 with detailed information on 80,000 anonymous taxpayers (0.2% of the Italian population of IRPEF taxpayers). From a policy perspective, the results of the study are useful to understand the current discussion on the reform of the tax system in Italy, which started with the reform of IRPEF at the beginning of 2022 and is contained in the delega fiscale, being one of the objectives of the national Recovery Plan. In Italy, according to the last report of the Commission on Tax Expenditures, in 2020, there were 602 tax expenditures, with a raise of 13% with respect 2019. This pattern moves in the opposite direction with respect to the objectives set by the different Italian governments in the previous years. The main IRPEF tax credits, based on the number of beneficiaries and average benefit, without considering the deductions for the main residence and the pension contributions, are: family allowances, dependent workers, mortgage interest, health expenditures, home renovations and energy efficiency expenditures, ‘80 euro’ bonus (as subsequently modified). The analysis is interesting also for helping the current discussion on the recent tax credits for home renovations like the 110% superbonus.
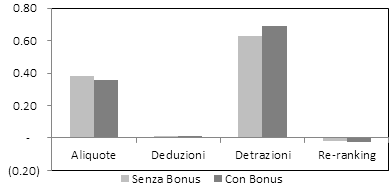
Figure 1 reports the role of the main tax components of IRPEF in terms (percentage) of the Reynolds-Smolensky (RS) index, as calculated from the decomposition of the effects proposed by the author. The RS index is a redistributive measure widely adopted in the literature to describe the consequences of the fiscal system on both vertical and horizontal equity. In this case, the author considers the effects with and without the ’80 euro’ bonus (introduced in 2014 – the year of the analysis). As for vertical equity, the redistributive effects of IRPEF are mostly due (more than 90%) to the main tax components: tax rates, tax credits for family allowances, and dependent workers. The introduction of the ’80 euro’ bonus has contributed to ameliorate the redistributive role, in terms of vertical redistribution, of IRPEF, by reducing the average tax rate for the beneficiaries. However, from figure 1, it can be observed that the ’80 euro’ bonus has negatively contributed to horizontal equity – equal treatment of taxpayers that are comparatively equal – as measured from the re-ranking term. This is due to the fact that this tax credit is selective for dependent workers within certain income thresholds.
The author applies a new decomposition methodology of the RS index that is useful to identify the effects of the different tax components of IRPEF (tax rates, deductions, tax credits) on vertical and horizontal equity punctually. Following the decomposition proposed in the paper, three main results are worth noting.
First, most of the tax credits IRPEF register a low contribution to the reduction in the vertical iniquity that is present in the Italian income distribution; such tax instruments, however, show a relevant effect in terms of horizontal iniquity. About 90% of the re-ranking of IRPEF is due to the tax credits analysed in the paper.
Second, some tax components of IRPEF, such as the proportional rate on rental income from residential properties (Cedolare secca sugli affitti ad uso residenziale) and the expenditures for home renovations and energy efficiency (for the fiscal year 2014), mostly benefit top income taxpayers, which are in the upper part of income distribution in Italy. Consequently, the tax reduction for these top income recipients is higher than for the rest of taxpayers and, therefore, the revenue losses of the State are higher. As for the Cedolare secca, for instance, the top 1% of Italian taxpayers saves on average 800 euros in terms of taxes, while the tax reduction for an average taxpayer is equal to 20 euros.
Third, there are results that provide a territorial overview of the distributive effects of the main tax components of IRPEF in the twenty Italian regions. Looking at the Cedolare secca, for instance, the tax reduction of the top 1% of taxpayers in the fiscal year 2014 was equal on average to 1,115 and 980 euros in Lazio and Piedmont, respectively.
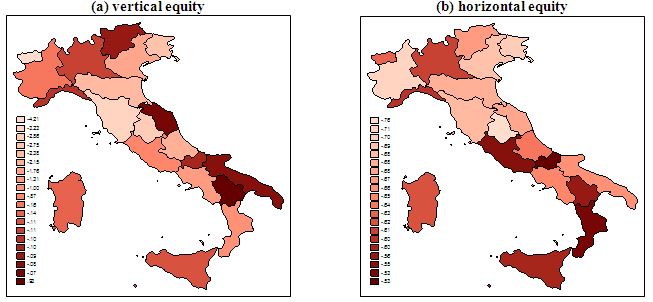
Figure 2 shows the effects of the tax credits for home renovations and energy efficiency expressed in percentage terms with respect to the vertical (figure a) and horizontal (figure b) equity component of the RS index in the twenty Italian regions. In graph a), the regions that show light colors are those where the negative effect of the tax credits on vertical equity (on total RS index) is higher. In substance, in these regions, the tax credits for home renovations and energy efficiency mostly favour the richest taxpayers. In graph b), the regions that show light colors are those where the negative effect of the tax credits on horizontal equity, as measured in terms of re-ranking, is higher. It is worthwhile noting that the consequences on horizontal equity are uniformly distributed across Italian regions, whereas the effects on vertical equity are more concentrated in some regions, such as Veneto and Lazio.
From a policy point of view, and in the light of the recent debate on the fiscal reform in Italy, the study highlights the need of assessing the total effects of tax expenditures, both on vertical and horizontal equity, by means of a careful evaluation of the recalibration of such tax expenditures that show more cons than pros.